A look inside the workbook
What it is and what it is for
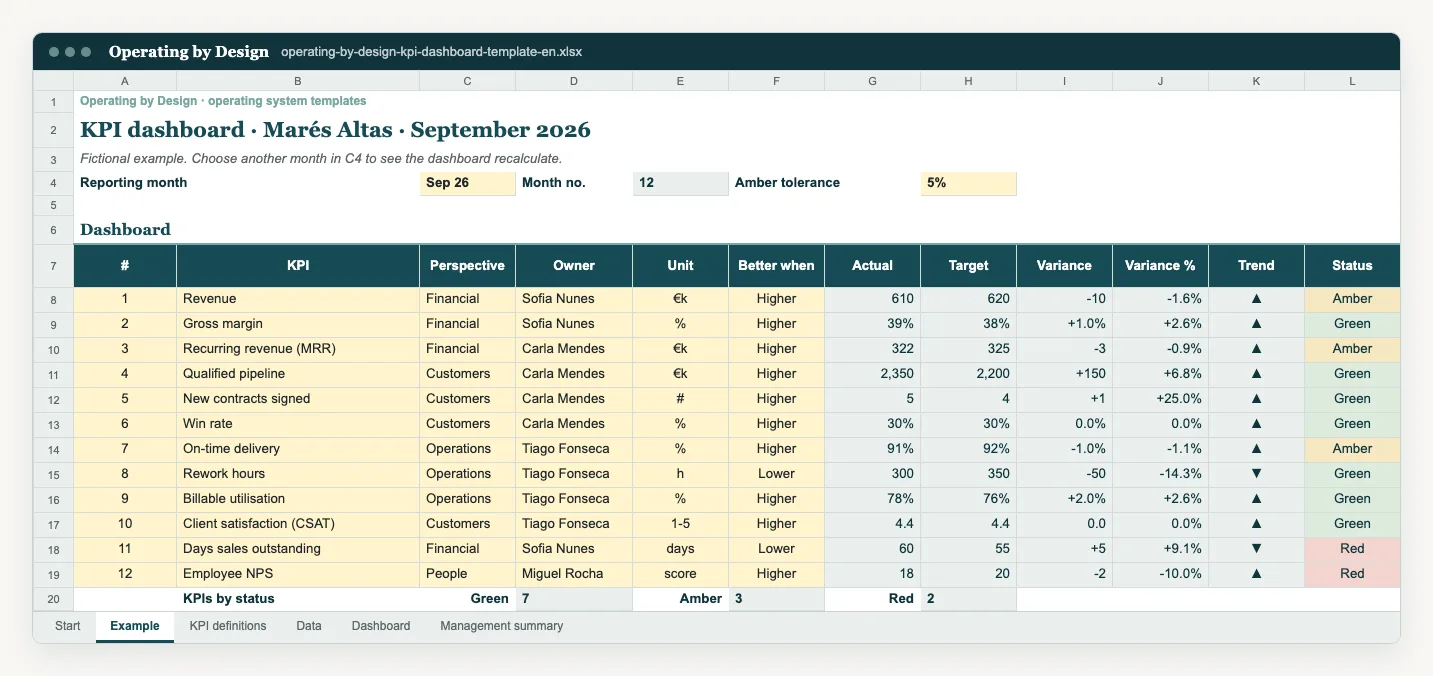
A KPI dashboard shows, in one view, whether the business is performing as planned. This template lists each indicator with owner, period, actual and target, calculates variance and status automatically and charts the trend over the last twelve months. The management summary brings together the indicators that need attention, so the meeting starts with what matters rather than with reading tables.
Who uses it and when
CEOs, COOs and leadership teams who need a short set of business KPIs. Each KPI has an owner who updates the value and explains the variance. Finance or operations usually makes sure the data arrives on time and with the same definition every month.
Update the dashboard once a month, right after the close, and use it in the monthly business review. Faster operational indicators can be checked weekly. Review the KPI list once or twice a year, or when the strategy changes.
How to use the template
- 1.Choose between eight and fifteen indicators that explain how the business performs. A few useful KPIs beat many ignored ones.
- 2.For each KPI, write the definition, the data source and the owner. Without an agreed definition, the same number changes meaning from month to month.
- 3.Set the target for each period in the yellow cells. Variance and status are calculated automatically.
- 4.Fill in the last twelve months of history so the chart shows the trend, not just the current month.
- 5.Update actuals right after each close and ask each owner for one sentence on any material variance.
- 6.Use the management summary to open the meeting with the indicators that are off target, and end with decisions and actions rather than commentary.
Data access and limitations
A KPI only helps if its definition and source are stable; record any change in how it is calculated. Watch for indicators that become goals in themselves and get managed for the number rather than for the business. Restrict access to sensitive financial data to those who need it. The Marés Altas example is fictional and its figures are not market benchmarks. The file contains no macros.
Common questions
How many KPIs should a management dashboard have?
For a leadership team, between eight and fifteen is usually enough. Each indicator needs an owner and should lead to a decision when it goes off target.
What is the difference between a KPI dashboard and a company scorecard?
The dashboard tracks management indicators in detail and over time. The company scorecard groups a few measures by perspective, such as financial, customers, operations and people, for a top-level reading.
Can I connect the file directly to my systems?
The template is built for manual entry or pasted exports, without macros. If you later connect automatic sources, keep the same definitions and owners.
References and use
These are practical Operating by Design resources. Suggested cadences and quantities are starting points, not universal standards. References consulted on 16 October 2026:
- Harvard Business Review · Don’t Let Metrics Undermine Your Business
- Harvard Business Review · Kaplan and Norton, The Balanced Scorecard: Measures that Drive Performance (1992)
Adapt the workbook for internal use in your organisation. Preserve the source attribution. Avoid unnecessary personal data.
From template to implementation
If the challenge needs more than a template, leadership alignment and a cadence that holds, see how we implement this with teams.
Explore the related service

